1. Overview
Background
Aircraft that bury the engine inside the fuselage bend the intake duct into an S shape, because stealth requires that the fan not be visible from the front. The price is a curved duct that sets up an adverse pressure gradient along its walls, and with it separation and secondary flow. If that non-uniform flow reaches the aerodynamic interface plane (AIP) intact, it becomes a cause of compressor surge.
S-duct design is therefore a problem in which the requirement to hide the fan conflicts with the requirement to deliver uniform flow.
What this article covers
Two things are needed.
A way to generate a smooth duct — the intake throat is non-circular because it follows the fuselage, while the AIP is circular. Placing the intermediate cross sections between them arbitrarily produces steep pressure gradients that cause separation on their own.
A way to judge whether a geometry is good — as we will see, average performance metrics alone are not enough to choose between geometries.
This article covers the procedure for generating the geometry and the metrics for judging it.
2. Geometry generation — treating a cross section as a signal
The cross section has to vary continuously from the intake throat to the AIP. We recast that morphing as a signal filtering problem.
Read the cross-sectional outline as a signal in the angular coordinate, and a circle is a signal with only low-frequency content left. So if the throat outline is transformed with an FFT, its high-frequency content removed, and the result inverted with an IFFT, what comes back is a sequence of intermediate sections in which a non-circular shape converges smoothly onto a circle.
2.1 The procedure
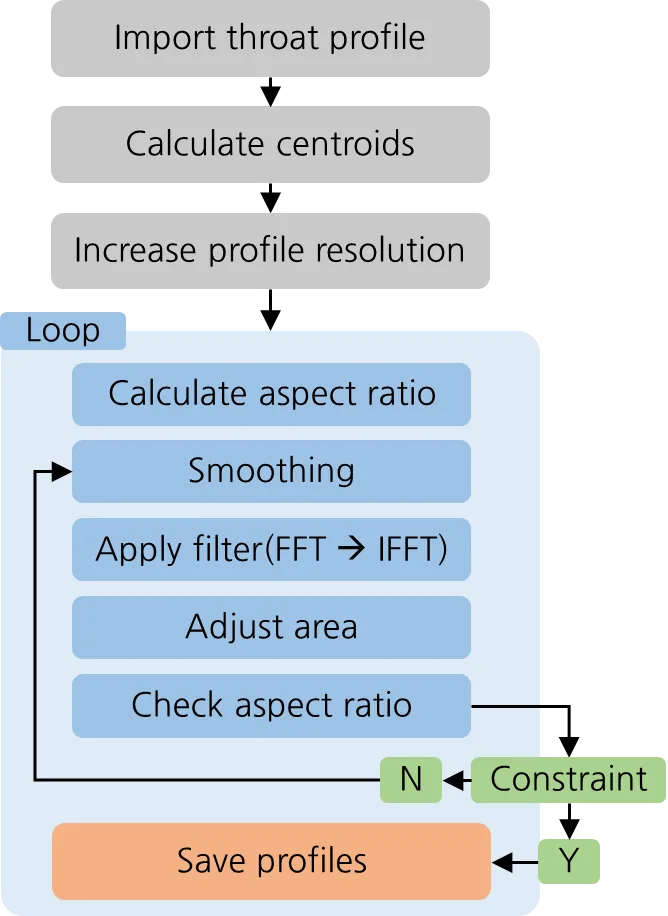
One pass of filtering is not enough, because filtering smooths the outline at the cost of changing its area. Duct area is a design specification and must not drift. The procedure is therefore built as follows.
- Take the throat outline as input and compute the centroid of each section — the reference the sections are aligned on
- Refine the outline resolution. Too few points and the filtered result comes back coarse
- From here on it is a loop
- Aspect ratio — how flat the current section is
- Smoothing
- FFT → IFFT filtering
- Area correction — restore the area that filtering changed to the target value
- Aspect-ratio check — exit if the constraint is satisfied, otherwise go back to smoothing
- Store the section sequence that satisfies the constraint
The essential point is that area correction and the aspect-ratio constraint sit inside the same loop. They push against each other, so they cannot be satisfied in a single pass.
2.2 The knobs
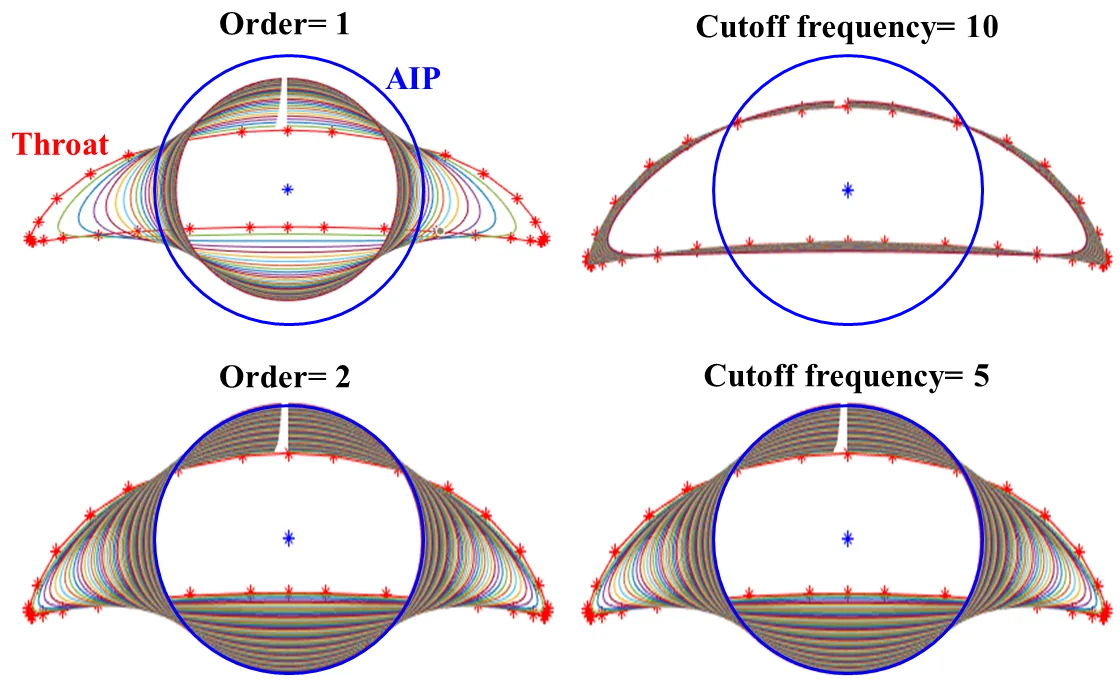
The filter has two knobs.
- Cutoff frequency — where to start cutting. The lower it is, the faster the section converges on a circle
- Filter order — how steep the roll-off is
The generated sections are then distributed along a curve joining the throat to the AIP. That centreline is a fifth-order Bézier curve, whose five control points set where the offset happens and how hard it is.
In short, the geometry is generated automatically once these values are fixed.
- Throat cross-sectional outline
- AIP area
- Relative position of throat and AIP
- Cutoff frequency and filter order
- Bézier control points
3. How distortion is evaluated
Judging a geometry requires metrics. This article uses two.
- Pressure recovery — how much of the freestream total pressure survives at the AIP. It measures the size of the loss.
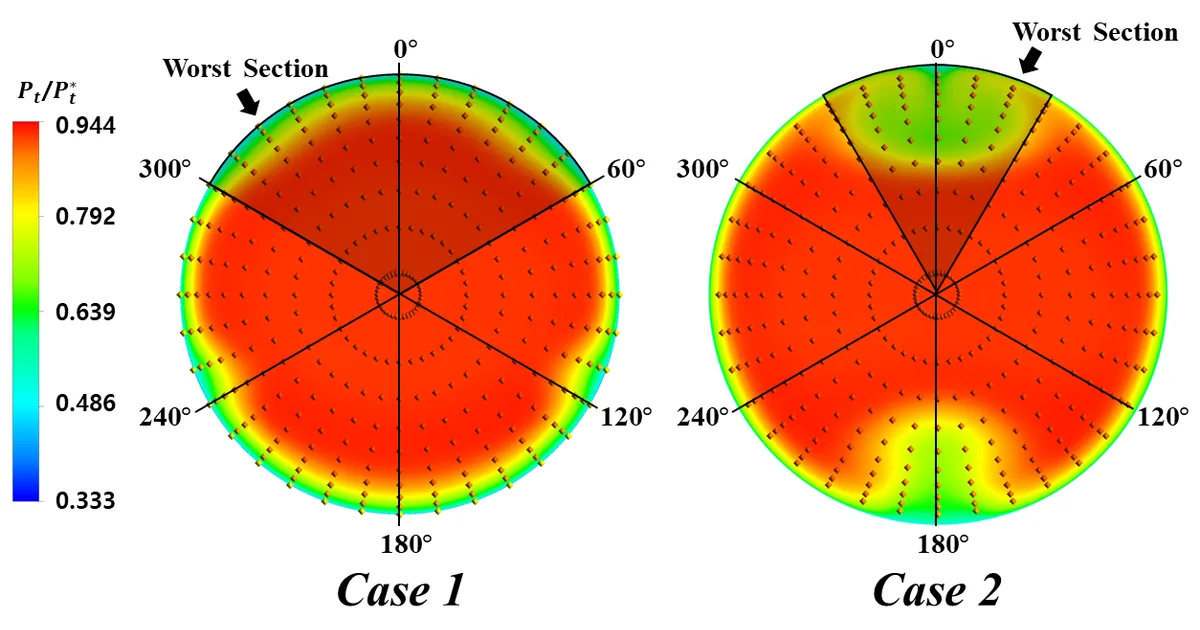
- DC60 (distortion coefficient over 60°) — dividing the AIP into 60° sectors, how far the worst sector departs from the mean. It measures the skew of the loss, that is, the distortion of the flow.
The first is a mean, the second a deviation. It is the deviation that causes surge.
Obtaining both requires an array of probes at the AIP, and the placement rule follows SAE-ARP-1420-B: the number of rings and arms together with hub and tip ratios fixes the positions.
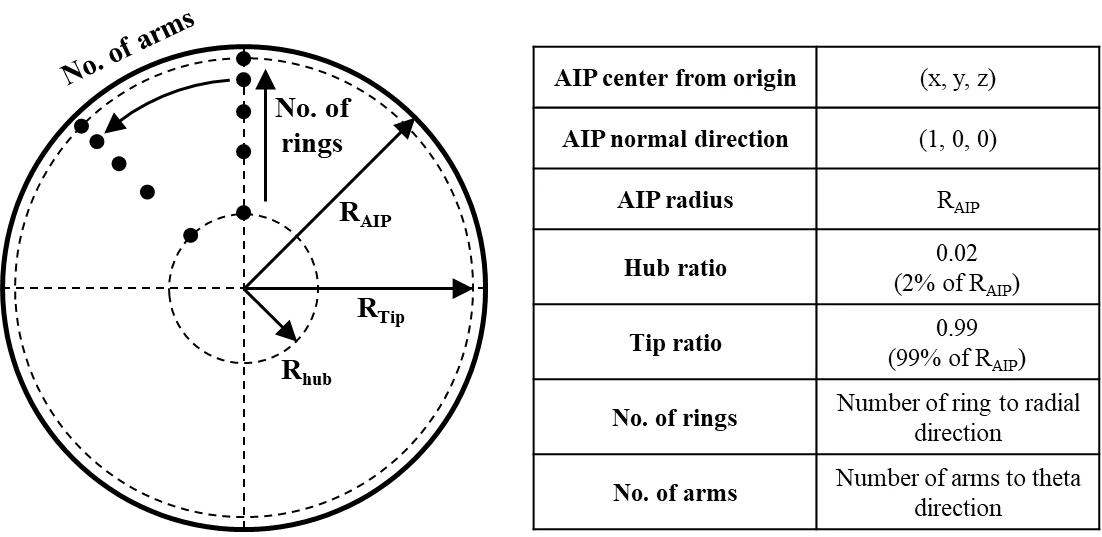
We implemented the program that extracts values at these probe locations from the solution and computes DC60 and pressure recovery.
4. Solver validation
The generation and evaluation procedure is only trustworthy if the analysis behind it is. We validated against the M2129 S-duct, for which published experimental data exists. Turbulence was modelled with SST k-ω, and a freestream region was added ahead of the intake so that the inflow condition stays close to reality.
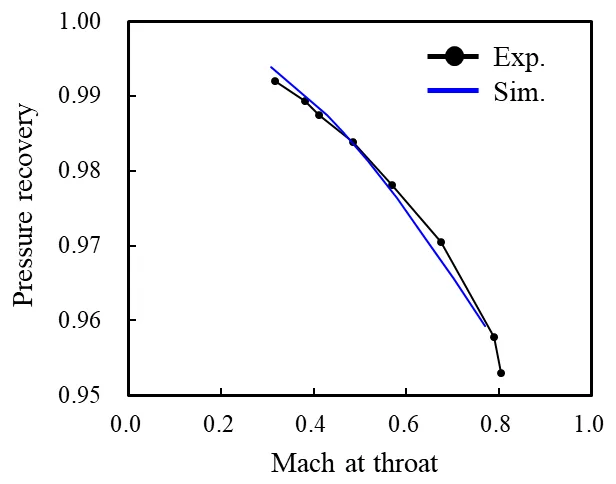
Across the throat Mach number range of 0.3 to 0.8, the maximum error was under about 1.0%.
5. Comparing two geometries
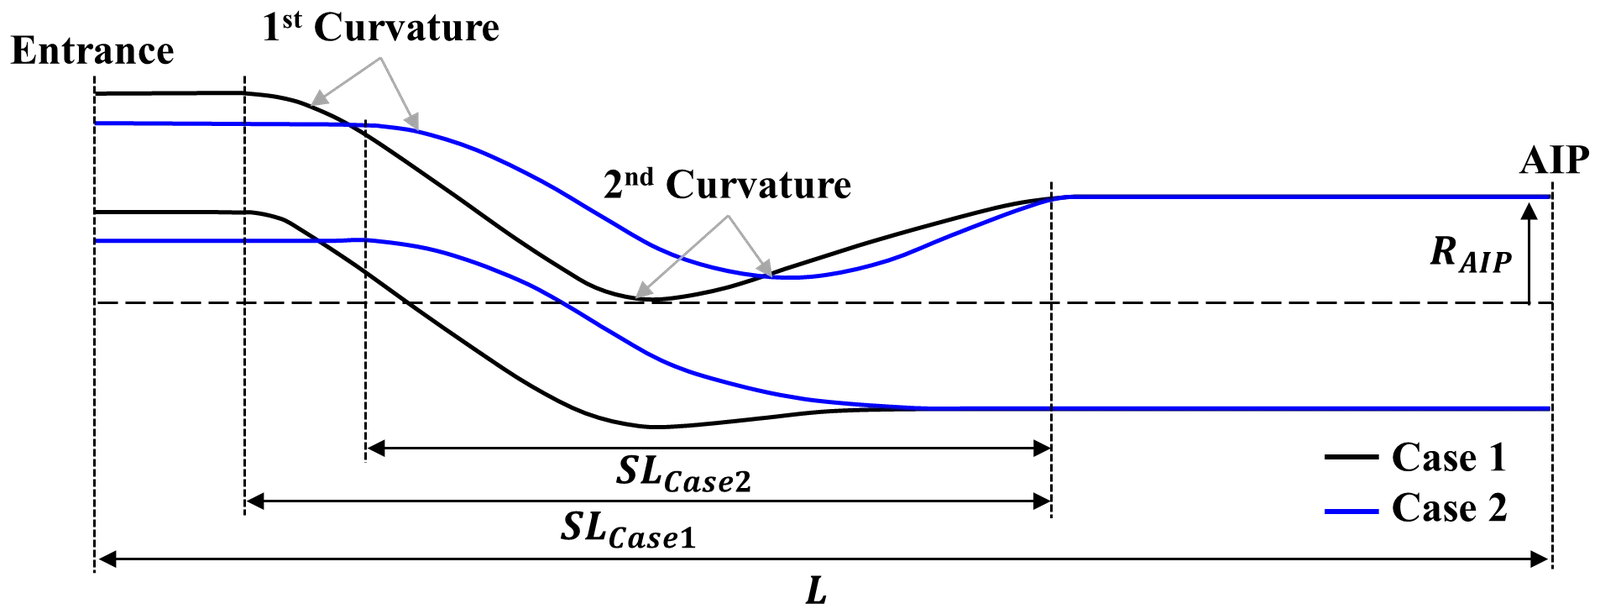
We generated two geometries with the procedure above, differing in intake height and in where the offset occurs.
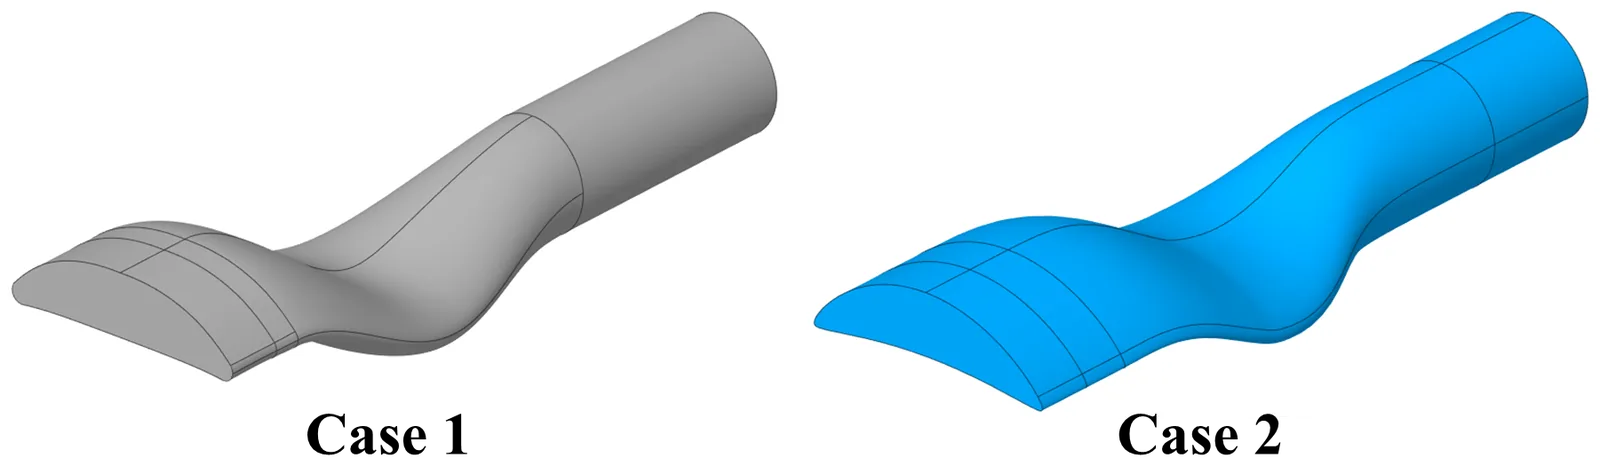
The difference is clear from the side. Overall length L is the same, but Case 2 has a shorter offset length SL. The same vertical offset has to be absorbed over a shorter distance, so the curvature is sharper.
The internal total pressure field shows separation at the bend in both geometries, but to a different degree.
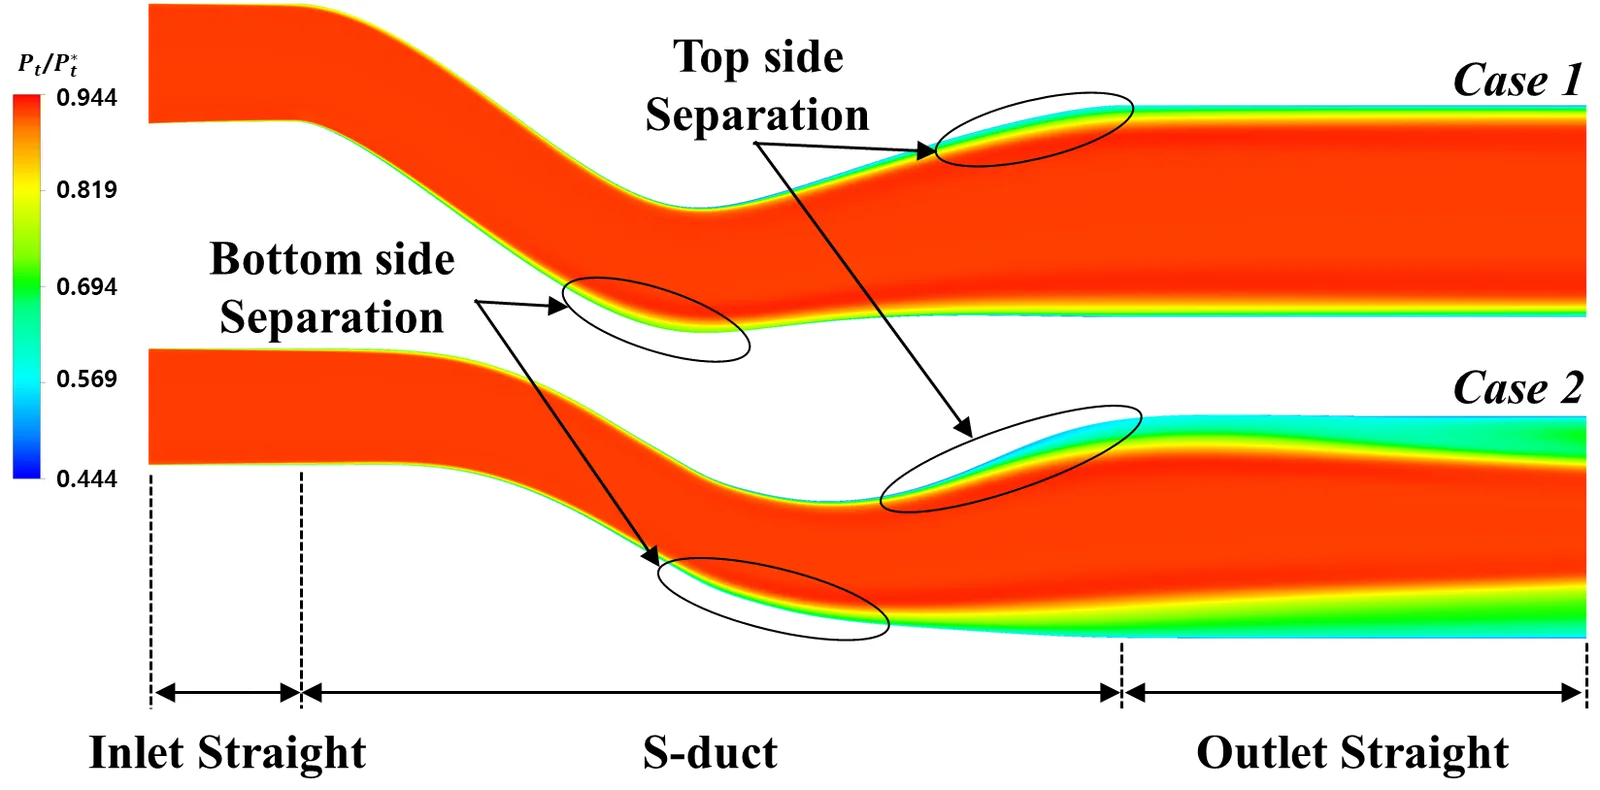
Case 1 shows only a mild separation above the second bend, whereas in Case 2 the separation grows large enough that the low-pressure region continues into the straight exit section.
At the AIP the difference becomes unmistakable.
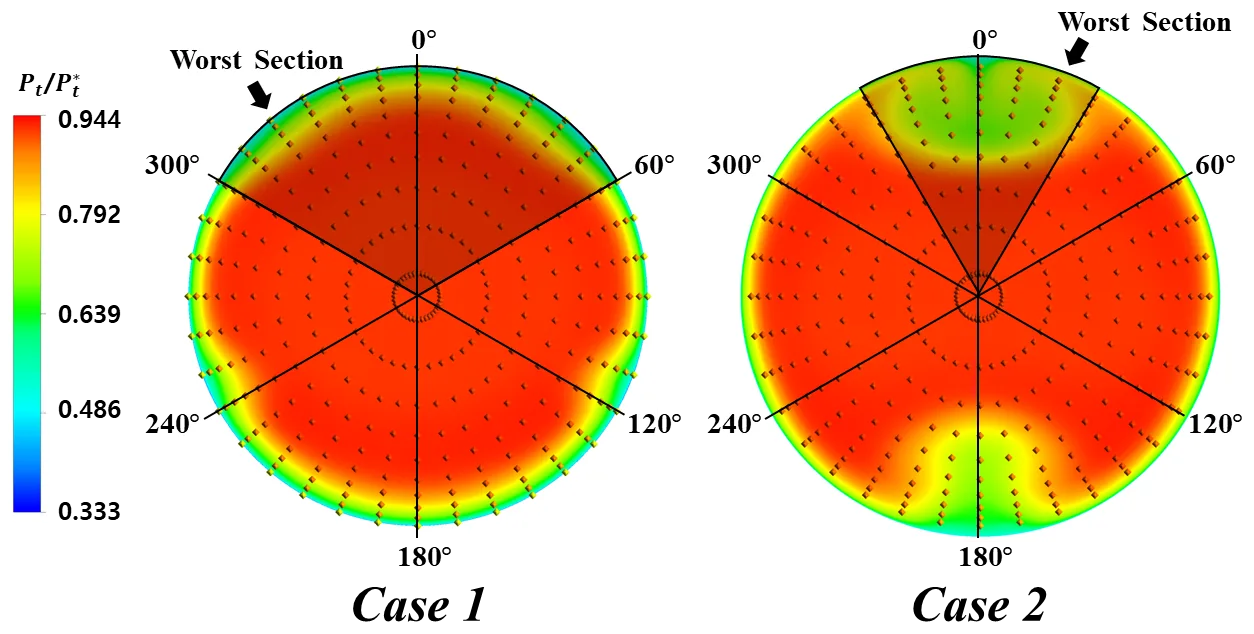
| Metric | Case 1 | Case 2 | Difference |
|---|---|---|---|
| Pressure recovery | 0.9864 | 0.9859 | 0.0005 |
| DC60 | 0.0152 | 0.1572 | −0.142 |
| Worst sector | 300°–360° | 330°–30° | — |
This is the point of the article. Pressure recovery is 0.9864 against 0.9859 — a difference of 0.05%. On average performance the two geometries are effectively identical. Yet DC60 is 0.0152 against 0.1572, an order of magnitude apart.
Choosing on pressure recovery alone could have meant picking the geometry with ten times the surge risk. Both geometries are within an acceptable range in absolute terms, but if one has to be chosen, the basis for that decision is DC60, not pressure recovery.
6. Conclusions
- Treating the intake outline as a signal and filtering it with an FFT yields a section sequence that morphs smoothly from a non-circular throat to a circular AIP. Because filtering changes the area, however, area correction and the aspect-ratio check must sit inside the loop and repeat until the constraints are met
- The centreline the sections are distributed along is a fifth-order Bézier curve whose five control points set the offset. For the same overall length, a shorter offset length means sharper curvature and larger separation
- Distortion evaluation follows the SAE-ARP-1420-B probe layout to produce DC60 and pressure recovery
- The analysis was validated against published experimental data (M2129) with a maximum error under 1.0%
- Average performance metrics and distortion metrics rank geometries differently. Intake geometry should not be selected on pressure recovery alone