Overview
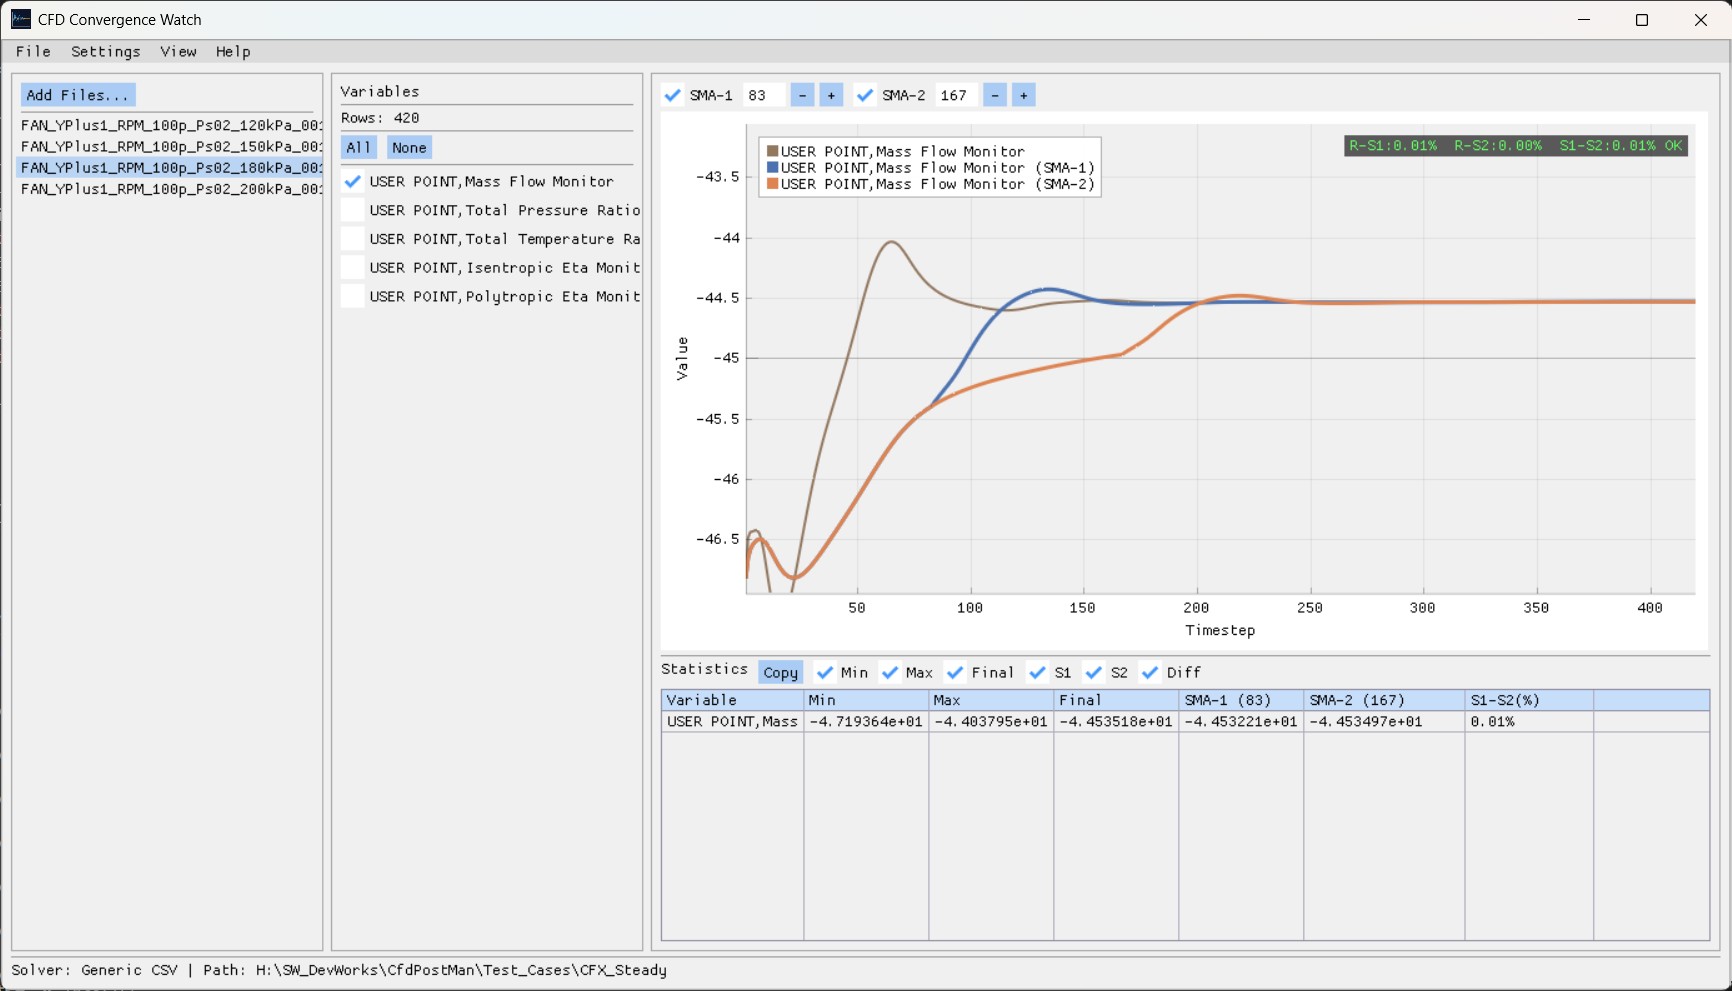
A light desktop tool that shows the oscillation and the steady or unsteady trend of monitor variables such as CL, CD and CM at a glance, and colour-codes the convergence indicator so it can sit at the convergence checkpoint of an automated pipeline.
Output from both open-source and commercial solvers is supported. From a CFX result file (.res) it
also extracts the USER POINT monitor data automatically.
Where it is used
Replaces "judge it by eye" with an objective, repeatable criterion: the gap between two SMA lines.
Reviews results unattended at the convergence checkpoint of a parameter sweep or optimisation workflow.
Puts the monitor variables of several runs on one screen to compare trend and convergence rate.
Pulls the USER POINT monitor history out of a CFX `.res` file straight to CSV, with no separate post-processing.
How it works
- 01 Load a file or folder
Read solver output such as `.csv` and `.out`, or a CFX `.res` result file.
- 02 Pick a solver preset
Choosing CFX, Fluent, Flow360, SU2 or generic CSV applies the right axis and parsing rules.
- 03 Select variables
Tick the monitor variables to plot — CL, CD, CM and the rest — in the variable panel.
- 04 Set the SMA windows
Two moving averages with different window sizes are computed together to show the trend.
- 05 Read the convergence marker
OK / ~ / X markers appear on the chart based on the gap between SMA-1 and SMA-2.
- 06 Check the statistics table
Means and SMA values in tab-separated form, copyable straight into a spreadsheet.
Convergence thresholds
Key features
Two simple moving averages over different windows, shown together, to judge stability quantitatively.
OK / ~ / X markers put the convergence state on the chart itself.
Pan, zoom and auto-fit, several variables at once, and the ImPlot right-click options menu.
Tab-separated output copies to the clipboard and pastes straight into a spreadsheet.
Writes USER POINT monitor data from a `.res` file out as `_userpoints.csv`.
Dark, light and classic themes, with a customisable panel layout.
Supported solvers
| Solver | Modes | File formats |
|---|---|---|
| ANSYS CFX | Steady | .csv, .res |
| ANSYS Fluent | Steady / Transient | .out |
| Flexcompute Flow360 | Steady / Transient | .csv |
| SU2 | Steady | .csv |
| Generic | — | .csv |
System requirements
- Operating system
- Windows 10 / 11 (64-bit)
- Graphics
- DirectX 11 capable GPU
- Input files
- CSV / OUT (CFX, Fluent, Flow360, SU2, generic) · CFX .res
- Output files
- Statistics table (clipboard, tab separated) · _userpoints.csv